Kevin Borland is the author of Borland Genetics, a fantastic site where you can upload your Raw DNA data, match to others, and use tools to reassemble your ancestors’ DNA. I very recently wrote a blog post about Kevin’s site.
Kevin also has a blog in which he has been posting very interesting articles, usually of an analytic nature which are the type I really like. Yesterday, Kevin posted an excellent article: Help! My Segments Are So Sticky! in which he clearly explains how he calculated the probabilities of age ranges for 7 cM and 20 cM autosomal segments, where he used 25 years = 1 generation.
So Kevin gives another take on the segment age estimates done by Speed and Balding in their 2014 paper made available online by Doug Speed:
Relatedness in the post-genomic era: is it still useful?
In the Genetic Genealogy Tips & Techniques group on Facebook, Blaine Bettinger posted about Kevin’s article and said: “I would absolutely love to see Kevin address the differences between his calculations and the calculations in the Speed & Balding paper, how fun that would be!”
I’ve always felt that Table 2B from the Speed and Balding paper overestimates the age of segments for a given segment size. I wrote two articles on my blog in 2017 with alternative analyses and compared them to Speed and Balding:
- Revisiting Speed and Balding – 5 Nov 2017
- Another Estimate of Speed and Balding Figure 2B – 15 Nov 2017
And I further updated that with another calculation in my article:
- The Life and Death of a DNA Segment – 19 Aug 2019
Those articles received many comments, including one from Doug Speed, and much discussion on Facebook.
So I was very interested to see what Kevin’s analysis says. Let’s compare.
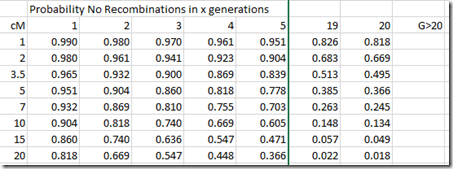
Using Kevin’s easy to follow method of calculation, I can first calculate the probability of no recombinations in x generations:
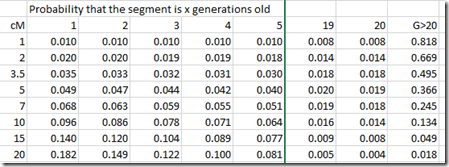
And then I simply subtract each column from the previous to give the probability that a segment is x generations old:
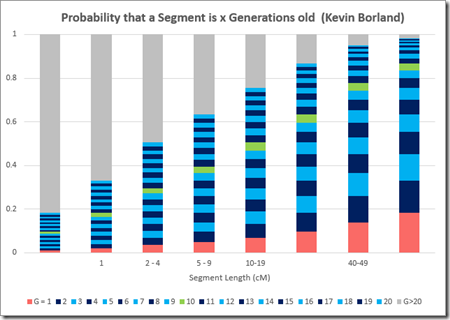
Now let’s plot this in the Speed and Balding chart format:
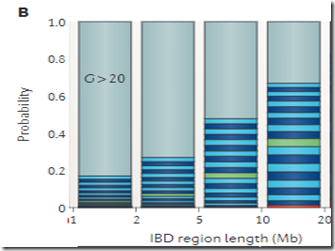
Lets compare this to the Speed and Balding Figure 2B chart that everyone quotes. I’ll cut off the left and right sides which have smaller and larger segments that we’re not comparing:
Speed and Balding uses ranges, so for Kevin’s chart above, I used values at the start, middle and end of each range. Speed and Balding uses Megabases (Mb)and Kevin uses centimorgans (cM), but they are close enough for practical purposes.
What we see is:
Speed and Balding, 1 – 2 Mb: About 18% chance of <= 20 Generations
Kevin Borland, 1 – 2 cM: Between 18% and 33% chance of <= 20 Generations
Speed and Balding, 2 – 5 Mb: About 28% chance of <= 20 Generations
Kevin Borland, 2 - 5 cM: Between 33% and 63% chance of <= 20 Generations
Speed and Balding, 5 – 10 Mb: About 50% chance of <= 20 Generations
Kevin Borland, 5 - 10 cM: Between 63% and 87% chance of <= 20 Generations
Speed and Balding, 10 – 20 Mb: About 68% chance of <= 20 Generations
Kevin Borland, 10 – 20 cM: Between 87% and 98% chance of <= 20 Generations
So indeed, Kevin’s figures do corroborate with my own and indicate that Speed and Balding’s table likely are an overestimate to the age of segments of a certain size.
Disclaimer: I sort of knew after reading Kevin’s article that his estimates would be similar to mine, since I used the same calculations as Kevin in my Life and Death of a DNA Segment article, except that I used the Poisson distribution for the starting probability rather than the 1 cM = 99% estimate that Kevin used.


