Another new feature announced during #RootsTech is the MyHeritage DNA integration of Evert-Jan Blom’s AutoClustering method. MyHeritage has become the first major DNA service to offer clustering.
MyHeritage’s blog post Introducing AutoClusters for DNA Matches was posted yesterday and describes their new service.
MyHeritage in their post says:
“This new tool was developed in collaboration with Evert-Jan Blom of GeneticAffairs.com, based on technology that he created, further enhanced by the MyHeritage team. Our enhancements include better clustering of endogamous populations (people who lived in isolated communities with a high rate of intermarriages, such as Ashkenazi Jews and Acadians), and automatic threshold selection for optimal clustering so that users need not experiment with any parameters.”
I looked at several autoclustering methods a month ago in my Comparing Genetic Clusters post. I included Evert-Jan’s Genetic Affairs program at the time. Those methods at the time all used Ancestry matches. Now I’m interested seeing what AutoClustering does with my MyHeritage matches, especially in the light of my endogamy.
So let’s try it.
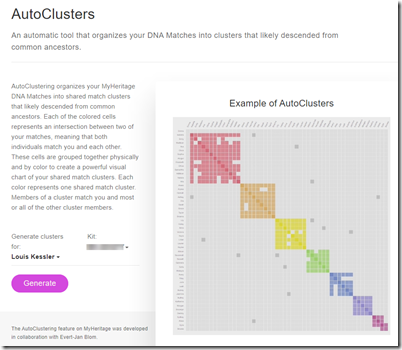
On my DNA Tools page, I selected AutoClusters.
The illustration shows a clustering example diagram.
The “Generate clusters for” and “Kit:” dropdowns allow me to select from my 3 possible kits:
- The MyHeritage DNA test that I took.
- The FTDNA test that I took that I uploaded to MyHeritage
- The FTDNA test that my uncle took that I uploaded to MyHeritage.
I pressed the Generate button for each of the 3 kits. After pressing the button, up pops the following box:
I did this yesterday about noon hour, 5 hours or so after this service went live. I saw on Facebook that some people were receiving their results in an hour or two. But as more people found out about this and submitted their requests, the queue started to grow. I did not get my results until the next morning.when I found the three results in my inbox. The emails were from 1:30 a.m., so they took over 13 hours to get generated and sent to me. I expect that the waiting time will come down considerably once the initial excitement period subsides.
What You Get
You get a zip file (mine are about 80 KB each) which expand to three files:
- An HTML (browser) file that displays your cluster chart with the amazing bit of animation that Evert-Jan developed to organize the clusters in front of your very eyes. Just hit refresh (F5) to display this hypnotizing effect over and over.
- A CSV (comma delimited file) that contains all the data in columns that can be loaded into Excel for analysis.
- A ReadMe.pdf file that gives you information about the analysis done for you.
The HTML and CSV files are given the name:
Louis Kessler Auto Clusters – kk-kkkkkk – March 01 2019.sss
where kk-kkkkkk is the kit number and sss is .html or .csv.
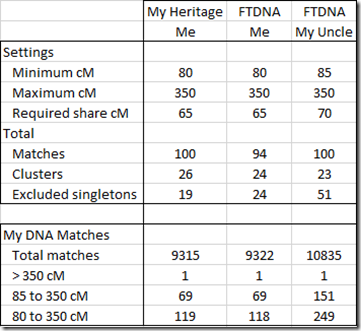
The ReadMe.pdf name always has that name. So if you don’t rename it, one will overwrite the other. They are identical except that they contain information about your clustering run, so you should rename it to associate it with the other two files. My info from the three ReadMe files, along with my match statistics tell me the following:
The clustering algorithm in all cases excluded my match with my uncle.
My test gave me 9,315 matches, of which 119 are between 80 cM and 350 cM and the clustering algorithm excluded 19 singletons and grouped the other 100 into 26 clusters.
My transfer from FTDNA was similar. My uncle’s transfer from FTDNA had more closer matches than I had. That’s the advantage of testing someone a generation back. So the clustering algorithm used a smaller range, 85 cM to 350 cM to only include 100 people.
My Test versus My Transfer
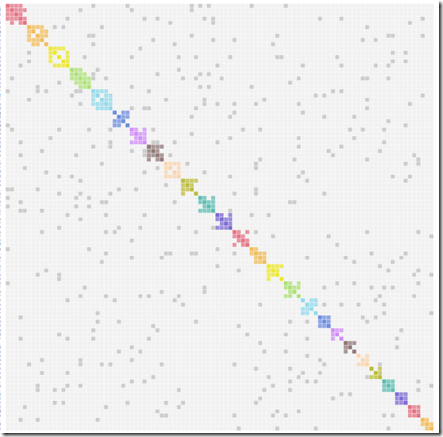
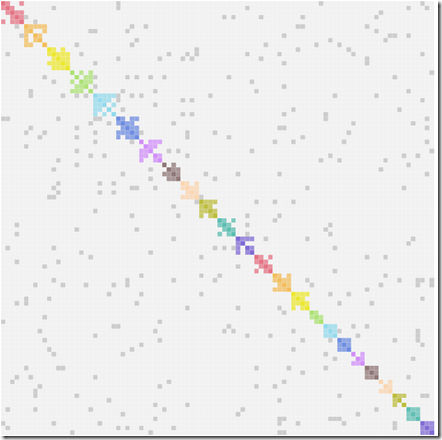
These are my clusters from my MyHeritage DNA test:
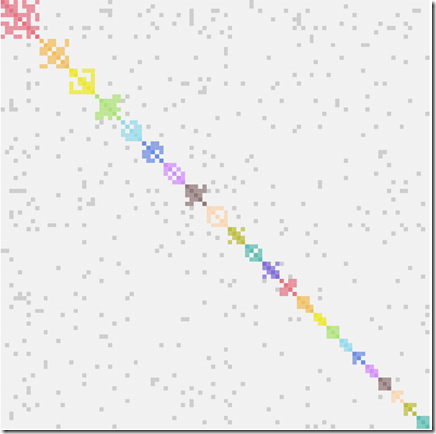
These are my clusters from my transfer from FTDNA:
They look almost identical and that is good. There are two fewer clusters from the transfer file, but you can barely tell. And despite my endogamy, there are not a lot of grey squares representing matches outside of clusters.
When I compare individual people and the groups they are in, I note that the groups are numbered differently in the two reports, but I can align the groups and most of the people match. There were 100 people in the MyHeritage clusters, and 94 in the FTDNA transfer clusters. MyHeritage has 9 people that FTDNA doesn’t have, and FTDNA has 3 people that MyHeritage doesn’t have. Of the remaining 91 matching people, 11 of them disagree as to which group they are in. So that leaves 80 people who are put in the same group from both clusterings. Pretty good.
Determining Common Ancestors
Unlike my Ancestry DNA matches, where I know my relationship to about 10 of my matches, at MyHeritage other than my uncle, I don’t know how I’m related to any of my 9,314 matches or to my uncle’s 10,834 matches. So at MyHeritage, I cannot use known tested relatives to determine common ancestors for some of the clusters.
Comparing My Clusters with my Uncle’s Clusters
At MyHeritage, I can look at the Shared DNA Matches between myself and my uncle. My uncle is my father’s full brother, and I share 1,994 cM on 52 segments with him. So our shared matches should mostly be on my paternal side. The matches I have that I don’t share with my uncle should mostly be on my maternal side. This is one comparison that I cannot not do at Ancestry, since I only tested my uncle at FTDNA and Ancestry does not accept uploads of raw data from other companies.
The Shared DNA Match list with my uncle shows only 3,114 Matches. To my surprise, that’s only 33% of the 9,314 matches I have. Since my uncle represents my full paternal side, you’d expect that it would be 50%. I’m guessing that either more people on my maternal side tested at MyHeritage than my paternal side, or maybe endogamy is allowing me to match some people by combining my maternal and paternal totals – and my uncle simply doesn’t meet the criteria to match them. By comparison, at FTDNA, my uncle and I match 10,182 people (57%) in common out of my 17,881 matches and my uncle’s 18,680 matches.
When I go through my Shared DNA Matches that I have with my uncle, I find just 6 matches among the 100 people in my clusters, and they are in 5 different clusters. Not only that, two of those are in my uncle’s excluded singletons, so that leaves just 4 people in common between my clusters and my uncle’s clusters.
The low number of people in common prevents me from combining my uncle’s clusters with mine to try to identify whether my clusters are on my paternal or maternal side. I’m very surprised that this happens, but it is likely because my uncle’s top 100 matches have little overlap with my top 100 matches.
So I won’t be able to directly compare my uncle’s clusters to mine by person as I had hoped. None-the-less, lets go forward anyway and look at my uncle’s clusters:
This also does not look much different than my clustering, but the people that make them up are different. We only have 4 of the people of the 100 shown here in common between us.
Clustering is potentially very useful if you know your relationship to some of the matches. Unfortunately for me at MyHeritage, I’ll have to wait until I determine my relationships with some of my DNA matches before I’ll be able to make full use of MyHeritage’s new clustering information.

