Back to Behold, but still DNA.
I am adding some DNA features to Behold that I know I need and are not in any genealogy programs currently out there.
Basically, I want to know the expected (i.e. mean) amount of autosomal, X, Y and mt DNA that each person will share with main person (or people) selected for the family. This is a centimorgan (cM) amount. It is straightforward to figure out, since the expected autosomal amount gets halved every generation, Y and mt only get passed through the male and female lines respectively, and X, although slightly more complicated, is manageable with females getting all their father’s and half their mother’s and males getting half their mother’s.
In addition to that, I want to know the probability of no segments matching. This is important, because if you have a 5th cousin, and you know that there’s, say, a 50% chance that they will not match at all, then you should only expect that half of the 5th cousins that DNA tested will match you somewhere. And fewer than half of them will show up as matches with your DNA testing company because the companies have a minimum match criteria before they claim two people match, and they need to do that to prevent too many false positive random matches.
I took a look to see if I could find the theoretical probabilities that I needed. I found at the ISOGG page on Cousin Statistics two tables:


I found it very interesting that these two tables give the same information but with slightly different numbers. For instance 4th cousins are 9 generations (DNA-wise) apart sharing on average (1/2)^9 = 1/512 of their DNA. And a person with their 7xgreat grandparent also shares 1/512 of their DNA. But the 1st table gives 30.70% for 4th cousins, and the second gives 37.43% for 7xgreat grandparents. I would have thought these two numbers should be the same, and I can’t check the original article these were derived from because I’m not a PubMed author and don’t know any PubMed author’s who can invite me.
None the less, the numbers in these tables are reasonably close to each other. So now I just need a method to calculate them for any degree of generational distance. I love when I get to do something statistical which was part of my education and my work. Not too often have I had to use my statistics education for genealogy, so here’s my chance.
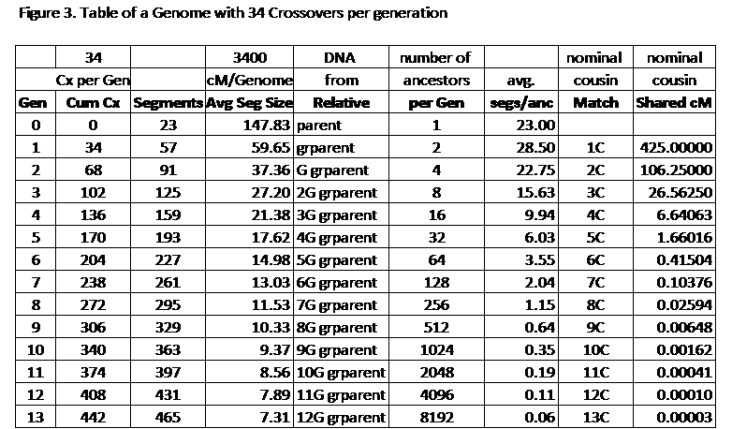
Let’s go to Jim Bartlett’s blog post: Crossovers by Generation. Take some time to read it and learn something like I did. I’m going to reproduce Jim’s Table 3:
The important columns are the one’s marked “Segments” and “Number of Ancestors”. Because there are on average 34 crossovers per generation, the number of segments grows linearly, 34 per generation. But the number of ancestors is growing exponentially, doubling every generation. After 9 generations, there are more ancestors than segments. By generation 13, there are 8192 ancestors, but only 465 segments. That means at most only 465 out of those 8192 ancestors will match, and that’s if none of them match on more than one segment. That already tells you that at least (8192 – 465) / 8192 = 94.32% of your 13th generational relatives will not match you.
Now let’s use some statistics. The statistical probability of no segments matching given that there are N ancestors and S segments is:
(1 – 1 / N) ** S
What that says is that for generation 13, there is a 8191/8192 chance of a person not matching in one segment, and the non-match has to be in all 465 segments. Calculate this out and it comes to 94.48%.
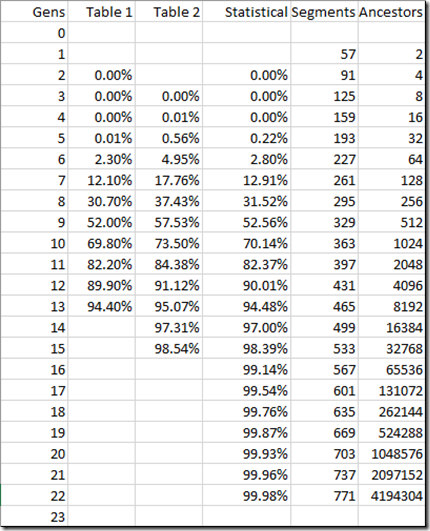
Let’s do that for a bunch of generational levels and compare that to Table 1 and Table 2:
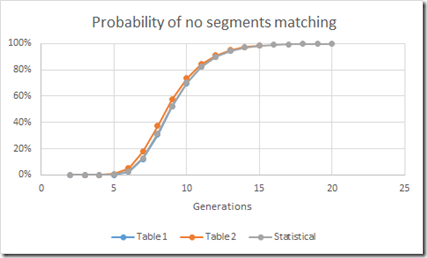
Hmmm. Not too bad. In fact the Statistical calculation comes very close to the Table 1 numbers. So close, that when I plot the three sets of values, you see a small difference only with the Table 2 numbers but the other two are right on top of each other.
Excellent. So now I have validated that these numbers are close enough and that I can therefore use them.
One last thing left to do. The mean amount of autosomal DNA passed down is always halved each generation. On average, that means with a 13 generational difference, the expected DNA shared is 1 / 8192 = 0.01% which would work out to just 1 cM. That’s an awfully small match to be detected.
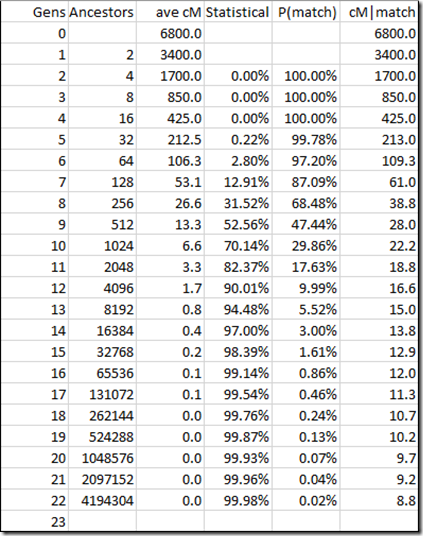
But that average includes all the ancestors who don’t match at all. We know that 94.48% or 7740 of the 8192 do not match. Better is to show the expected DNA matching when the two people do match. This would then be just 1 / 450 = 0.22% which would work out to an expected average match of 15 cM for the 450 people 13 generations apart that do match.
Let’s try this for the whole range of generations::
So now I have what I need. Behold is going to show:
- The probability of having a DNA match (e.g. 5.52%)
- The average match length if they do match (e.g. 15.0 cM)
Let me of course add 100 caveats. These are approximate values. The actual percentages may vary. Matching cM may vary greatly, etc., etc., blah, blah.


