Is it true genealogists have more fun?
Unfortunately I had to miss #genchat on Twitter last night. The questions and answers this week were about DNA testing, starting with MRCAs and then branching out.
For those of you who do not know what #genchat is, it is a genealogy based Twitter chat that happens every 2nd Friday night.
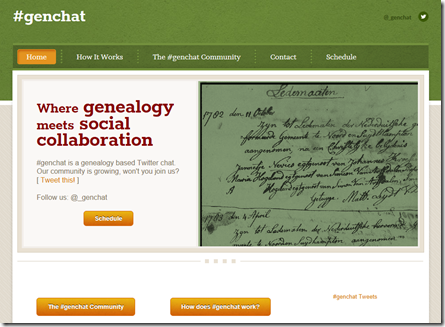
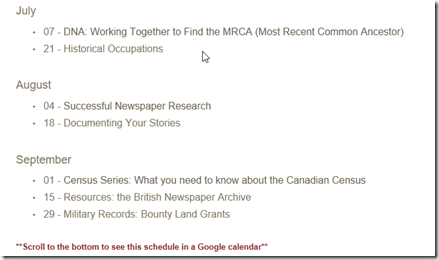
They tell you more about it at their website genealogygenchat.com and include a schedule of their upcoming chats:
Jen Baldwin is the host of #genchat using the handle @_genchat when she’s hosting and is often supported by Kale Liam Hobbes @leprchaunrabbit
The sessions use a Question and Answer format. The host asks a series of questions and the participants just go at it for a whole hour.
Since I missed last night’s #genchat and it was on DNA, a topic I am very interested in, I wanted to go back and review what I had missed. I thought a good way to do so would be to record a transcript of what was said. I’m including this here to give everyone a flavour of this community and show you what your missing.
Here goes:
#genchat @_genchat
Tonight we’re talking about MRCA - Most Recent Common Ancestors #genchat
#genchat @_genchat
Q1: What is a "Most Recent Common Ancestor" MRCA #genchat
Patriot Genealogy @DaveGoerss
Another acronym to memorize 
#genchat
#genchat @_genchat
HAHA! Perfect answer! #genchat
Christine McCloud @geneapleau
A1 I guess the ancestor that you have in common with your DNA match
TalkingBoxGenealogy @talkingboxgen
A1: The most recent ancestor you share with your DNA matches #genchat
Sally ✊ @SallyOnTheGo 3h3 hours ago
A1: the ancestor(s) to which you and your DNA match share by DNA and traditional genealogy #genchat
Ken Waters @FamilyTreeAZ
A1: The closest (most recent) ancestor shared by two persons. #genchat
Michael F. Harris @mfhy2k
A1 an ancestor sharing DNA with 2 people that tested. #genchat
Aussiemandas @Aussiemandas
A1: MRCA is the point where two people who have done their DNA test intersect and share the one ancestor. #genchat
Family Sleuther @FamilySleuther
A1: The ancestor that you and a distant cousin share in common. The unknown who you & your genetic cousins are trying to identify. #genchat
Liz Loveland @lizl_genealogy
A1 Answer seems to be in the question ;-) Whomever you and your DNA test results match are most recently both descended from. #genchat
Scott Niblick @SNiblick
A1: the closest common ancestor that you both share that you both received the same DNA from. #genchat may be more than one common ancestor
Don Varner @donvarner1_don
A1 What Liz said. #genchat
Renate Sanders @Nadasue
A1 #genchat The most recent common ancestor shared with another person - usually in DNA-speak
#genchat @_genchat
Q2: Is the MRCA always limited to just two people? Cuz nearly everyone said that… #genchat
Sally ✊ @SallyOnTheGo
A2: nope. There are half relationships. Ancestors have married more than once with families. #genchat
Christine McCloud @geneapleau
A2. Maybe via testing, but definitely more via the paper trail. #genchat
Jenna Mills @SeekingSurnames
A2 Ancestor is singular so I’m calling trick question on this one. #genchat
Liz Loveland @lizl_genealogy
A1 No it’s definitely not necessarily limited to one person, but many people start out with just one or two matches for a MRCA #genchat
Scott Niblick @SNiblick
A2: you can be related by more than one couple and connection. #genchat
Don Varner @donvarner1_don
A2: No, could have matched to siblings as one example #genchat
Erin B, PharmD @eeb31
A2: no! See ancestry’s DNA circles for a decent example. 20 relatives with this MRCA!
Ken Waters @FamilyTreeAZ
A2: ?? 2 persons as in 2 MRCAs or as in 2 matches? Certainly possible to have only single MRCA due to mult marriages etc. #genchat
Aussiemandas @Aussiemandas
A2: The MRCA varies and can be only one person if half relationships are involved. Each genuine match you have will have a MRCA #genchat
Jean McKenney @McKenneyJean
A2 No it does have to be limited to two people #genchat
#genchat @_genchat
The MRCA is the most recent common ancestor shared by all individuals in the population under consideration. (Wikipedia)
Q3: Why is the MRCA so important to genealogists? #genchat
Renate Sanders @Nadasue
A3: The MRCA gives genealogists a starting point for each line of research. #genchat
Sally ✊ @SallyOnTheGo
A3: if you triangulate (have several common matches in one spot), other matches share those ancestors. Thus more sharing! #genchat
Scott Niblick @SNiblick
A3: it helps verify the tree, helps with determining side of family for unknowns and we love chasing puzzles. #genchat
Family Sleuther @FamilySleuther
A3: Identifying MRCA may advance your pedigree depending on what your genetic cousin knows about the family line #ShowMeFamilyBible #genchat
Ken Waters @FamilyTreeAZ
A3: Allows merging of branches of family trees and helps ID other common matches into the tree. #genchat
Aussiemandas @Aussiemandas
A3: Its like climbing a hill, you get to the top (MRCA) and then you can see over the other side and find new connections. #genchat
#genchat @_genchat
Q4: How do you determine the MRCA with a potential match? #genchat
Sally ✊ @SallyOnTheGo
A4: traditional paper research #genchat
Ken Waters @FamilyTreeAZ
A4: Have to go back to traditional genealogy—compare trees. #genchat
Scott Niblick @SNiblick
A4: compare trees and communicate with your matches. Compare surnames and common locations. #genchat
Lyndall Maag @lzmaag
… undertake #gapanalysis & plan future research strategies #genchat
Scott Niblick @SNiblick
Can you explain what you mean by #gapanalysis ? #genchat
AnceStories @kidmiff
A4: Collateral research! I’ve been able to find out how matches connect b/c of research I put into ALL my ancestors descendants! #genchat
Oops! Should be "…ancestors’ descendants!" #genchat #punctuationmatters
Erin B, PharmD @eeb31
#genchat a4: step one- compare trees/ known info
Renate Sanders @Nadasue
A4: In most cases this is where conversation becomes necessary - comparing trees surname locations, etc &then there’s triangulation #genchat
Family Sleuther @FamilySleuther
A4: To determine MRCA for Y-DNA matches, carefully compare #genealogy notes. Where does the paper trail overlap? #genchat
Aussiemandas @Aussiemandas
A4: Look for matching Family Trees everywhere Ancestry, Gedmatch, FTDNA, Wikitree, My Heritage, Family Search, Google #genchat
Liz Loveland @lizl_genealogy
A4 Easiest way is for you & them to both have family trees posted online. But even then, it’s not always obvious #genchat
Liz Loveland @lizl_genealogy
A4 Part 2 Issue could be because of error, because the paper trail itself is wrong, because match is past a brick wall, … #genchat
Liz Loveland @lizl_genealogy
A4 Part 3 And as we all know not everyone posts a tree! So in those cases you need to look at who you both match, or contact person #genchat
#genchat @_genchat
Tonight’s topic is just as much about collaboration as it is about DNA. So, let’s turn that direction. #genchat
Q5: How do you reach out to a potential match? What’s the strategy that works best? #genchat
TalkingBoxGenealogy @talkingboxgen
A5: I haven’t had too much luck there #genchat
#genchat @_genchat
I find DNA is like cold-calling sometimes… and it doesn’t always go so well. 
#genchat
Family Sleuther @FamilySleuther
As in you mean folks treat you like a telemarketer and don’t answer? #genchat
#genchat @_genchat
Um, yeah. Like that. #genchat
Jenna Mills @SeekingSurnames
A5 Email or message service depending on test company. Give match kit details, ask for a response and wait and wait and wait #genchat
Sally ✊ @SallyOnTheGo
A5: email if possible, provide test/kit #’s, general names/locations. It’s a fine line between over- and under-providing info ;) #genchat
Don Varner @donvarner1_don
A5: Begin by sending a message to the match via service showing the match (FTDNA, et.al) #genchat
Ken Waters @FamilyTreeAZ
A5: Be as specific and courteous at the same time. Mention kit#s (thinking gedmatch of course) and surnames that may match #genchat
AnceStories @kidmiff
A5: When I email, I share any story and/or photo I have of our MRCA or of the family in general because… #genchat
Scott Niblick @SNiblick
A5: who matches who, at what company, at what relationship level and then ask a simple question to get a response. Don’t overwhelm #genchat
Erin B, PharmD @eeb31
A5: hi! I’m so and so. Based on this info I have and this info from your tree, we’re related. Can I learn more? #genchat
AnceStories @kidmiff
A5: …most of my matches aren’t serious genealogists or know much about DNA. Hook ‘em with the stories/photos! #genchat
Mary Bernthal @BernthalMary
A5: Reach out with an email and bait them with the possibility you’ll share the family records you’ve gathered! #DNA #genchat
Ken Waters @FamilyTreeAZ
A5a: If on Ancestry pray for any kind of answer…! #genchat
Angela Y.Walton-Raji @AYWalton
LOL! I agree with that! #genchat
Jean McKenney @McKenneyJean
Yes, I am slow answering on Ancestry but at least I do. Sometimes I forget to check messages. #genchat
Angela Y.Walton-Raji @AYWalton
A5 I find that it is hit or miss #genchat A polite intro with a bit of geographic references for the family sometimes works.
Don Varner @donvarner1_don
A5: I don’t provide kit #’s etc unless I get response. Note the match info and family lines. #genchat
Ken Waters @FamilyTreeAZ
I do kit #s as others manage many kits just like I do. I’ve seen too many vague e-mails and don’t have clue which kit matching. #genchat
Aussiemandas @Aussiemandas
A5: I don’t I add potential matches to my Ancestry tree and let them contact me. #genchat
Sally ✊ @SallyOnTheGo
A5: it isn’t US, it’s THEM lol #genchat
Renate Sanders @Nadasue
A5: Email until you get response! Then more emails chats phone calls Im usually pretty passive/non-threatening w/ initial contact #genchat
Patriot Genealogy @DaveGoerss
A5: they may google us and get intimidated #genchat
Christine McCloud @geneapleau
Those crazy #genchat people!
Patriot Genealogy @DaveGoerss
scary bunch ! #genchat
Jenna Mills @SeekingSurnames
AH! never thought my Twitter habit may be turning off potential cousins!! Well, TDB!!! :) #twitterforlife #genchat
Patriot Genealogy @DaveGoerss
Replying to @SeekingSurnames
you are the best twitterer #genchat
TalkingBoxGenealogy @talkingboxgen
I have found that adding a photo placeholder to my online tree for pics I have copies of will bring in interested parties #genchat
Liz Loveland @lizl_genealogy
A5 I have not found any one strategy to get a best response, so I do what works on me: Explain where I think we match if it’s known #genchat
Liz Loveland @lizl_genealogy
A5 Part 2 or if it’s not known but they have a tree posted, say any matching locations and/or surnames in my message. #genchat
Liz Loveland @lizl_genealogy
A5 Part 3 I have not really been able to do much with matches who contact me when we have no matching information at all #genchat
Jenna Mills @SeekingSurnames
Most definately, a tree posted online does NOT always help. hahahahahaha #genchat #baitandswitch
Chris Wright @AncestorDigger
A5 Just had a cousin reply nearly 12 months after my first message - she didn’t know about the messaging in Ancestry! #genchat
#genchat @_genchat
Q6: Which of the DNA services/platforms has the "best" messaging/communication system? Why? #genchat
AnceStories @kidmiff
A6: I’ve only used FTDNA and GedMATCH, so I can only say FTDNA is best of the two. Nothing wrong with GedMATCH, tho. #genchat
Christine McCloud @geneapleau
A6. Is it the system that makes it best, or the people testing? #genchat
Mary Bernthal @BernthalMary
A6: I’m relatively new to MyHeritage’s #DNA service, but I find their regular match updates the most helpful #genchat
Scott Niblick @SNiblick
A6: GEDmatch and FTDNA because you have email address and not internal message system they have to check. #genchat
Sally ✊ @SallyOnTheGo
A6: I prefer email. Unfortunately Ancestry and 23 use blind messages. Not everyone checks, or knows they can be notified of messgs. #genchat
#Genchat A6: I like @23andMe because I can make notations in Notes and it was my first and I get more responses through them.
That Girl! @MyTrueRoots
I find this particular conversation by what I’d call a group of expert genealogists very interesting, because even at this level there is not a perfect knowledge about this particular DNA concept.
Ken Waters @FamilyTreeAZ
A6: Don’t think there’s any one best one. Prefer those that provide emails rather than relying on msg system (listening Ancestry?) #genchat
Aussiemandas @Aussiemandas
A6: I am happy with Ancestry messaging I handle about 200 incoming messages a year. My replies are acknowledged promptly. #genchat
Jenna Mills @SeekingSurnames
WOW!! Who is messaging you? Matches and other folks looking at your tree? I’m lucky if I get 5 a year. :( #genchat
Liz Loveland @lizl_genealogy
My favorites on Ancestry are like one I got last week asking for info on a common-surname family. Me: Could you be more specific? #genchat
Liz Loveland @lizl_genealogy
I decided to respond asking for more specifics, at which point they mentioned a much much less common surname in my tree #genchat
Liz Loveland @lizl_genealogy
and I knew what they were talking about. But I wondered how many people just never respond to their super vague queries #genchat
Sally ✊ @SallyOnTheGo
A6: I’ll say it - I have THE WORST response rates through Ancestry. #genchat
Jean McKenney @McKenneyJean
I have had vry useful messages through Ancestry. My husband met his (unknown) half-brother by his niece contacting me thru Ancestry #genchat
Liz Loveland @lizl_genealogy
A6 I’m on 3 (FTDNA, AncestryDNA, 23&Me). I don’t find 1 to be best personally, they’re all different, plus client-base is different #genchat
Don Varner @donvarner1_don
A6: Ancestry messaging system works well for me. #genchat
Chris Wright @AncestorDigger
@SeekingSurnames Have heard that in Ancestry the green button doesn’t send an email but the brown button on profile does ??? #genchat
Jenna Mills @SeekingSurnames
Yes, I’ve heard one way or the other works better, don’t remember which. Tricky! #genchat
Don Varner @donvarner1_don
I get an email from Ancestry when someone sends me a message on it. #genchat
Sally ✊ @SallyOnTheGo
Many people don’t know that feature exists
Erin B, PharmD @eeb31
Ditto #genchat
Scott Niblick @SNiblick
I do too, but some have that preference setting turned off. #genchat
Chris Wright @AncestorDigger
plying to @SNiblick
Well that might explain it! Also, perhaps their emails go to spam and they never check it #genchat
#genchat @_genchat
Q7: There are several reasons to test for DNA… have you encountered matches that aren’t interested in #genealogy? and what did you do about it?) #genchat
Liz Loveland @lizl_genealogy
A7 I always assume those are the people that don’t respond! #genchat
Sally ✊ @SallyOnTheGo
A7: No one has ever said, but I would assume by not answering, they’re not interested. #genchat
Renate Sanders @Nadasue
A7: Yes. #genchat
Ken Waters @FamilyTreeAZ
A7: I’m guessing those are all the ones who don’t answer. A few have responded they’re not interested in genealogy, just ethnicity. #genchat
TalkingBoxGenealogy @talkingboxgen
A7: Yes, I assume they’re not interested in genealogy…or they don’t check their messages #genchat
Don Varner @donvarner1_don
A7: Definitely have matches that have no interest in #genealogy at all. Simply took the test for ethnicity results. #genchat
Christine McCloud @geneapleau
I think a lot of people have been doing that, with the mainstream commercials & all #genchat
Angela Y.Walton-Raji @AYWalton
True, for many folks that is all they really want. #genchat
Don Varner @donvarner1_don
My wife did to check her native American status (she was very disappointed) #genchat
Christine McCloud @geneapleau
Replying to @donvarner1_don
as are many native american princess descendants! #genchat
Family Sleuther @FamilySleuther
A7: I’ve sought out potential matches - not interested in #genealogy - and encouraged them to #DNA test. I tell our shared story. #genchat
AnceStories @kidmiff
A7 I’m assuming the 1s that don’t respond aren’t int. in genealogy, 4 the most part. Ethnicity results r big draw, tho unreliable. #genchat
Ken Waters @FamilyTreeAZ
A7a: Also got one interesting response once regarding NPE and wanting to hide results. Was a courteous response and thanked her. #genchat
Scott Niblick @SNiblick
A7 It’s hard to tell with accounts that are managed by someone else. You don’t know whethet they tested for health or genealogy. #genchat
Aussiemandas @Aussiemandas
A7: ok to be friends on FB or email but as we are elderly with multiple health issues we have no desire meeting cousins in person. #genchat
Jenna Mills @SeekingSurnames
A7 I messaged a Y DNA match that was a 1. He was interested for about 5 seconds. #genchat
Sally ✊ @SallyOnTheGo

#genchat
Ken Waters @FamilyTreeAZ
Wow, you’d think someone who sprung for a Y test would be more enthusiastic. #genchat
Family Sleuther @FamilySleuther
But five glorious seconds, I’m sure, right? #genchat
Jenna Mills @SeekingSurnames
For sure. He’s a professor at a college in Ireland. Thought I hit the jackpot for a minute, but nope. #genchat
Mary Bernthal @BernthalMary
LOL !!!! #genchat
Jenna Mills @SeekingSurnames
Yep, it was exciting while it lasted. LOL #genchat
Don Varner @donvarner1_don
I’ve had really good luck with my FTDNA surname project. #genchat
Chris Wright @AncestorDigger
A7 As hard as we try, we can’t turn everyone into progonoplexics! https://blog.myheritage.com/2015/08/do-you-have-progonoplexia/ … :-) #genchat
#genchat @_genchat
Q8: Have you ever encountered really serious / intense reactions? (Facebook groups seem to be full of those interactions…) #genchat
AnceStories @kidmiff
A8: Not yet. :-) #genchat
Don Varner @donvarner1_don
A8: Not with anyone answering messages. All have been polite and try to be helpful. #genchat
TalkingBoxGenealogy @talkingboxgen
A8: No. And I appreciate the lack of drama #genchat
Renate Sanders @Nadasue
A8:#genchat Oh yes! Dealt with one quite recently.Turns out he’s a bit off his rocker (it seems) so must steer clear.
We Go Way Back @waybackgen
A8 Not personally. I’ve heard stories from others who experienced strong reactions, or who had strong reactions to unexpected info #genchat
Ken Waters @FamilyTreeAZ
A8: One I recall is somebody who seemed to think it was my obligation to figure everything out on her side. Many emails. #pushy #genchat
Liz Loveland @lizl_genealogy
A8 I’ve encountered adoptees who are very emotional about trying to find out where they come from, which I understand #genchat
Angela Y.Walton-Raji @AYWalton
I can imagine the emotion. #genchat
Liz Loveland @lizl_genealogy
Me too. I had messaged with someone who was using a paper trail to try to find someone to test before I ever tested myself #genchat
We Go Way Back @waybackgen
A8 Some of it comes down to education. People don’t know what to expect from DNA, so they have (surprise) unrealistic expectations #genchat
TalkingBoxGenealogy @talkingboxgen
plus they’re sometimes disappointed with the results they do get, like no native american DNA #genchat
We Go Way Back @waybackgen
Then comes the genetic tree vs genealogical tree sitdown ;) #genchat
#genchat @_genchat
Q9: Do we need to know about the MRCA for ALL humans? Why or why not? #genchat
AnceStories @kidmiff
A9: Is that even possible? It’s so far back! #genchat
Christine McCloud @geneapleau
A9. shortcut answer: Noah. #genchat
Sally ✊ @SallyOnTheGo
A9: I have a hard enough time finding my own people :) #genchat
Ken Waters @FamilyTreeAZ
A9: Why, of course! We should all have full trees with no mysteries. #ItWillNeverHappen! #genchat
Chris Wright @AncestorDigger
A9: That would be great, but don’t know I’d live to see it. #genchat
Patriot Genealogy @DaveGoerss
just heard in news humans and Neanderthal commingled. Does that complicate things? #genchat
Family Sleuther @FamilySleuther
Or perhaps explains a few things… #genchat
Liz Loveland @lizl_genealogy
Anthropologist here. No, it’s not relevant to genealogical DNA test results #genchat
#genchat @_genchat
maybe not relevant per se, but fascinating, no? #genchat
Aussiemandas @Aussiemandas
A9: Thats the fun trying to work out who is the MRCA but if its not found today I will not stress over it. #genchat
Family Sleuther @FamilySleuther A9: Like mitochondrial Eve? I think ancient DNA study is fascinating. We’ll likely see exciting developments in the years to come #genchat
Scott Niblick @SNiblick
A9: we have a book for that :) Fo you choose Adam and Eve or Noah and his two by two ;) #genchat
Angela Y.Walton-Raji @AYWalton
A9. I don’t think it is an interest for most. In fact worldwide–is DNA research common? #genchat
AnceStories @kidmiff
A9: I’d say the closest we get to that today are Confucius, and Aaron the Israelite priest (ancestor of Cohens). #genchat
We Go Way Back @waybackgen
A9 I’m not sure it’s possible, given non-paternal events, burned counties, endogamous populations, etc. I’d also be out of a job ;) #genchat
#genchat @_genchat
The age of the MRCA of all living humans is unknown. May be as recent as 3,000 years ago. http://steveolson.com/uploads/2009/04/nature-common-ancestors2.pdf … #genchat
Liz Loveland @lizl_genealogy
I hope that’s a typo? Because it’s definitely not as recent as 3,000 years ago. #genchat
… AND ONE HOUR HAS PASSED
#genchat @_genchat
Have a great night everyone! Thanks again for being part of #genchat!
#genchat @_genchat
Next chat! July 21 - Historical Occupations - I luv, luv, luv this topic! #genchat
Jean McKenney @McKenneyJean
Good night all! Very interesting topic tonight! See you all next time! Have a good couple weeks . #genchat
Believe it or not, that all happened in an hour. It is called by some “the fastest hour of your life”.
I’m sorry I missed this session. There were a few answers I would have liked to have given, so what the heck, I’ll give them here now, and maybe tweet them later.
A1: The ISOGG definition of a Most Recent Common Ancestor (MRCA) is:
In genetic genealogy, the most recent common ancestor (MRCA) of any set of individuals is the most recent individual from which all the people in the group are directly descended.
A2: Note that ISOGG’s definition specifically says: “is the most recent individual” and “individual” is singular. The reason is that we are talking about a segment of DNA that is shared by a number of people. That common segment is passed down to all of them from just one most recent ancestor. Not two, not more than two. This is an important concept. When you do chromosome mapping, you map your DNA segments up to individual ancestors.
A9: Haplogroups are effectively the division of all people into their MRCAs. The Y-DNA haplogroups are our male MRCAs (our Y-chromosomal Adams) and the mtDNA haplogroups are our female MRCAs (our Mitochondrial Eves). These turn out to be very useful in helping to verify or disprove genealogical connections by comparing the haplogroups of potential male or female descendants of a suspected common ancestor.
Of course, I would have had to find a way to squeeze each of those answers into Twitter’s 140 character limit.
If you’re active on Twitter and into genealogy, check out #genchat on one of its Friday evenings. You’ll get hooked.



 Feedspot 100 Best Genealogy Blogs