Login to participate
  
Register   Lost ID/password?

Louis Kessler’s Behold Blog

A Year of “Retirement” - Fri, 24 Nov 2017

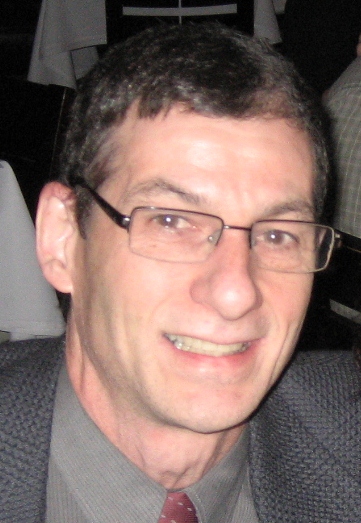
One year ago today, I celebrated my 60th birthday and on the same day I retired from my job of 41 years. Since then, it’s been quite a year. I wonder how I ever had time for a day job.

I recently got back from my 4th genealogy conference of the year. In February, I was at RootsTech in Salt Lake City, July at IAJGS at Disney World Florida, October at the Great Canadian Genealogical Summit in Halifax and I just returned from FTDNA’s Genetic Genealogy Conference in Houston.

Add into that two vacations, one a Western Caribbean cruise with my wife following RootsTech in February, and the second was a two-week family trip to Disney World Florida in June with my wife and older daughter while my younger daughter was working at Disney World for the summer.

The year started off with a “bang” after I had torn my peroneal tendon away from my right ankle while playing squash. I had the operation to reattach it on December 30. The next 5 weeks were on crutches and the 5 weeks following were in a walking boot, which I wore to RootsTech and on my cruise.

That marked the end of my 30 years of playing squash. I quit football at 30, running at 40, tennis at 50, and squash at 60. If I could last at biking until 70, swimming until 80 and walking until 90, I’ll have done pretty well.

I’ve been wearing the FitBit my work-people bought me for my retirement for a full year now. I average 6 hours of sleep a night, not counting about 1 hour awake a night, which I was surprised to learn is less than normal – according to FitBit, the average man my age is awake 15-31% of the night. I also learned that 10,000 steps a day is a really good goal and is not always easy to achieve. At 1,000 steps in 10 minutes, that’s 100 minutes. I learned that a day at a genealogy conference is in excess of 10,000 steps, and a day at Disney World is more than 20,000 steps. I have a few “FitBit Friends”, but it’s Carole Steers from England who I met at RootsTech who blows me away in steps every day. I don’t know how she does it.

On the programming front, I came out with a minor version of Behold in January. I’ve made progress towards what will be the last release before I add editing, and I’m close but haven’t yet had the time to finish it off.

One of the reasons for Behold’s slowdown is Double Match Triangulator. My highlight of the year was having the program win 3rd place in the RootsTech Innovator Showdown. In March I created a website for DMT and started selling it. I’ve released 5 updates to DMT in the past year and I’m currently working on a major update to be released very soon.

DNA analysis is so interesting and there is so much you can do with the data that nobody’s even thought about yet. I’ve done lots of analysis, written many blogs posts, given talks, and tried everything to confirm my genealogical relationship with even some of my DNA relatives (still unsuccessful, but it will eventually happen). Also enjoyed my first Twitter #genchatDNA a week ago. One of my tweets summarizes everything: 

I’ve also got a bit more active on some of the genealogy DNA Facebook groups, which have become very popular with tens of thousands of participants including many of the experts.

And let me thank several dozens of my Facebook friends who wished me a happy birthday on my Facebook timeline today, and also my Australian friends who who used their time-zone advantage to start the party early.

Quite a year. Still lots more to look forward to in the years ahead.

Another Estimate of Speed and Balding Figure 2B - Wed, 15 Nov 2017

Ten days ago, I produced an article: Revisiting Speed and Balding, where I tried to duplicate the results of their Figure 2B. I posted a link to the article on the ISOGG Facebook group, and received a lot of comments, mostly from Andrew Millard and Debbie Kennett. Debbie also provided quite a few comments directly on my post and contacted one of the authors, Doug Speed, who then also commented on my post. He indicated he’s confident his simulation results were accurately tabulated and suggested “the differences come from us asking slightly different questions”. I’m trying to answer the question:

For a match at a specific segment length, what is the probability that the segment comes from a particular generation?

That’s what I thought Speed and Balding were answering as well, so I’m unclear as to what the difference might be.

I thought one possible difference might be that I’m taking this from the perspective of the matches in your match list at Family Tree DNA. Debbie Kennett rightly pointed out that the inclusion of only DNA matches would only affect very small segments under 9 cM, since at least one segment of 9 cM or more (or 7.69 cM plus a minimum 20 cM total) is required before the person is considered a match. So that is not a question difference that would have affected the 10 to 40 Mb range where my statistical numbers significantly differ from their simulation numbers.

David Millard rightly pointed out that I was one generation off in my Expected number of cousins, but that wouldn’t change my results much. He also didn’t think that my figure titled: “Addition of Inverse IBD Region Length Distributions” was close to Speed and Balding’s Figure 2B, but that fact of the matter was that no matter what reasonable methodologies I could think of trying, that was the closest I could get to Speed and Balding’s result.

So I do not agree with Speed and Balding’s figure 2B. It would be nice to see if anyone else has done some similar calculations and compare.

In one of Debbie Kennett’s comments during our discussions, Debbie provided a link to an article that gave some data that looked like it could be used to do a third estimation of what Speed and Balding’s Figure 2B might be. The article is by Bob Jenkins and is titled: How many genetic ancestors do you have?

Genetic ancestors don’t help us that much, but Jenkins goes on to then estimate the number of cousins by generation by segment length. He gives one table for females and one for males. They are fairly similar but the male table has a few inconsistencies that the female doesn’t, so I’ll just use the female table. Bob Jenkin’s table looks like this:

Bob Jenkins table

And it goes all the way to 100 generations. Let’s interpret this. Pick 4th cousins.

That line says it’s generation 9, but this is counting every step up and down. Translating that to Speed and Balding’s value of G would make it G=5.

Then we see “6:5”. That means 5 cousins would have 1 / (2**6) of the DNA of the ancestor, which is 0.015625, which multiplied by 6800 total cM  gives 106 cM, or multiplied by 5334 total Mb gives 83 Mb.

Then we see “7:45”. That means 45 cousins would have 1 / (2**7) of the DNA of the ancestor which is 53 cM or 42 Mb.

Etc.

So we now put this all into a spreadsheet:

Number of detectable cousins (Jenkins)

and we divide by the column total to get the likelihoods:

Fraction of detectable cousins (Jenkins)

Plotting this in the Speed and Balding manner gives:

Fraction of detectable cousins (Jenkins)

Bob Jenkins does not give the same region lengths as Speed Balding. Jenkins uses region lengths that double, so we have to be careful in our comparison. Let’s compare Jenkin’s 3 Mb with SB’s 2-4, Jenkin’s 5 Mb with SB’s 5-9, 10 with 10-19, 21 with 20-29 and 42 with 40-49.

Here is Jenkins above lined up for comparison:

Jenkins lined up

Below are my final calculations from my article 10 days ago that were calculated using Speed Balding’s values for the probability of region length and the ISOGG table for number of cousins which I then extended until it reached the world population:

image

Note that Jenkins has no visible G>20 (very light blue) at 10 Mb and 21 Mb which agrees with what I came out with.

Compare this with Speed and Balding for the equivalent segments. Look at how much G>20 (the grey shade) there is between 5 and 20 Mb. That is the part that I cannot believe is reasonable, and neither can Jenkins.Speed and Balding lined up

For the smaller regions, under 10 Mb, Jenkins does include a significant amount of G>20 segments (very light blue). But when you look at your match list, those are not included because a match of 20 generations or more with almost always match on just one segment. And if that segment is 9 cM or less, then it won’t be considered a match at Family Tree DNA and won’t show up in your match list. My results don’t show any G>20 for any segment length, but neither Speed Balding nor Jenkins do and both of them show many G>20 for small segments smaller than 10 Mb.

The bottom line is that I don’t believe that Speed and Balding’s Figure 2B is appropriate to apply to the segment lengths of the matches in your match list. There is something undetermined that they don’t take into account.

Conclusion: Almost all your matching segments with any of your matches at any segment length will be within 20 generations. Small segments under your DNA company’s minimum match limit (e.g. 9 cM at FTDNA) will also be within 20 generations because people with segments that small from more than 20 generations back will not be in your match list.

The ISOGG Facebook group is a closed group, but if you have been given access to it, the comments there about this article are a worthwhile read.

Update: Mar 24, 2018.  New discussion about my articles took place on my comment in the closed Facebook group: Genetic Genealogy Tips & Techniques. I’d like to add here what I said there, because it is significant.

I think it is inappropriate to relate Speed and Balding’s results to what we see in our matches, mainly because what we see are filtered by the DNA companies by their minimum match criteria which will eliminate almost all people who only have distant small segments in common. The expected amount of DNA we share with people beyond 15 generations from us will seldom make it through this filtering and thus won’t be in the segments of our matches.

But Speed and Balding include all segments unfiltered, and they did it for a different purpose, specifically to find in their simulation individuals unrelated for a disease study. Their study is excellent for that purpose. So their population geneticist peers naturally and correctly accepted the paper and those findings.

My objection is that some genetic genealogist, I don’t know who, happened to find their paper and blindly apply their results to his/her segment matches. Then everyone followed suit and the use of their Figure for segment to genetic distance made it into the ISOGG Wiki. This action of inappropriately applying a result is what does not and did not get peer reviewed, but simply gets published and virally repeated as fact like an incorrect ancestor in an online family tree, and is thus so hard to correct or even get anyone to realize. It is the inapplicability of their result to our filtered segment matches that I’m trying to point out and dispute to the genetic genealogy community.

I should note that prominent genetic genealogist Debbie Kennett disagrees with me on this and says: “The Speed and Balding results are perfectly applicable to genetic genealogy so long as we bear in mind that they are a simplification.” With my disagreement to that noted, I invite readers to examine my arguments and decide for yourself.

Update: Aug 20, 2019.  I have done another calculation in my article: The Life and Death of a DNA Segment, which is based on segment life. Once again, this gives fewer generations than Speed and Balding does.

FTDNA’s 13th IGG Conference Lab Tour - Mon, 13 Nov 2017

#FTDNA2017 – What a great conference! So many people I could talk to at a technical level and so many that I learned from. I averaged less than 5 hours of sleep per night just because the day was so full, every morning was an early wakeup, and I had to watch Saturday Night Live. I left Winnipeg with 5 cm (2 inches) of snow on the ground and –10 C (14 F) temperatures, and Houston was 20 to 25 C (68 F to 77 F) but I wasn’t outside more than 5 minutes in those 4 days.

The morning after the Conference, I was signed up for the 9 a.m. Lab Tour at Family Tree DNA. Judy Russell and I shared a Lyft ride from the hotel to the FTDNA headquarters. That was my first ever ride of that type and I was impressed by both the service and the price and how you pay online (and tip online) and don’t have to mess with either cash or credit with the driver. But I can still say I’ve still never taken a Uber, which we don’t have in Winnipeg. (My taxi driver on the way home from the airport told me both Uber and Lyft will be starting in Winnipeg in February.)

The hour long Lab tour was something special. First of all, how often is your tourguide the President of the company? Bennett Greenspan got a dozen of us to put on white lab coats and those who had open toed shoes had to put disposable socks on, which were supplied.

I’m a software guy, and hardware baffles me. This is ALL hardware. We started with a robotic sorter, that placed several dozen samples into units that hold (I can’t remember any numbers so I’ll estimate everything) about 60 in each unit. These get placed in cases. Since everyone gives 2 samples, one goes for the current test and the other goes into 25 year storage.

We then saw the very large storage unit that is designed to store 2 million samples long term. This unit is not in service yet. It is the one talked about yesterday that they had to crane up to the 8th floor and remove the window to get it in.

We then were shown various DNA decoders ranging from the newest – a very slick looking device about the size of a washing machine costing a million dollars (Bennett said that particular cheque was hard to write), to two of the oldest that were of the type used to decode the first genome at a cost of billions of dollars. It took 100 of these devices and they cost $250,000 each. Bennett keeps them around because, although they are much slower, they do everything and are the gold standard against which they measure and check the newer machines.

We also saw and were given a glass chip to look hold and inspect. It is like and about the size of the glass slides you’d use with a microscope. It contained 24 small rectangles. Each of those is the results of a sample and is infused with the 700,000 SNP values from the sample.

There were way more steps than this, and I am amazed that this can even be done. Family Tree DNA is proud of their lab and its certifications and is continuously working to make improve the process with automation and increase throughput while maintaining quality control. Very impressive!

Photos were not allowed during the tour. To give you a feeling of the whole thing, the best I can do is provide a YouTube video by Family Tree DNA which shows and describes some of their lab equipment. It was made in 2015 so does not include the latest equipment, but gives you a good idea as to what it looks like, and the description is much better than my recollection of what Bennett said.

If you’re ever in Houston, see if Family Tree DNA is giving lab tours and sign up for one. After you’ve done that, then you can go see NASA (which I didn’t get to go to).

Below are my posts about each day of the Conference:

Jennifer Zinck posted a set of extensive notes from the Conference:

Judy Russell wrote a nice article about Michael Hammer’s talk:

Maurice Gleeson has his 2 talks from the Conference on YouTube:

Rob van Drie posted this report in German:

—-

Followup: After telling my daughter who has a genetics degree about my lab tour, she told me she learned about the whole process in her molecular biology course. And she pointed me to the following video which I simply must pass on:

The PCR Song, from 2008. (Polymerase Chain Reaction)