I took my first MyHeritage DNA test at RootsTech 2017 in Salt Lake City.
At RootsTech 2024 last March, MyHeritage announced Ethnicity Estimation 2.0 which is to be released this June. There are many good reasons to get their new estimates. The estimates will be a free update for all users who tested on MyHeritage’s Illumina GSA (Global Screening Array) chip (mid 2019 onwards).
Unfortunately, my test was from 2017 and used the Illumina OmniExpress Microarray Chip. So I would not get the new ethnicity estimates, and that got me thinking that there might be other updates in the future that my old test might miss out on.
So I made the decision to take another MyHeritage DNA test with their new chip and compare my results with my test from 2017 on their old chip.
From Ordering to Results
I ordered my new kit online on Sunday March 17, at what seems to be their perpetual sales price of $49 CAD (for Canadians).
The kit was shipped the next day (Monday March 18) from Lancaster, Pennsylvania and arrived in my mailbox on Friday March 22. I tested myself, activated the test online, and mailed the kit the next day (Saturday March 23) to their lab in Houston, Texas, which is actually the Family Tree DNA lab who do the processing for MyHeritage.
Online at MyHeritage, they let you track the progress of the test.
- Tuesday April 2, the kit arrived at the lab. They said from that point to expect the results on MyHeritage in 3 to 4 weeks.
- Wednesday April 3, DNA extraction was in progress.
- Friday April 12, Microarray process was in progress.
- Monday April 15, the raw data was produced
- Friday April 19, the results were ready and available.
So that only took 26 days which is less than 4 weeks from the time I ordered the test to when my results became available.
My first MyHeritage test which I took at RootsTech in 2017 took just over a month for the results to become available, so their delivery time has remained about the same.
Ethnicity Estimates
The new test still uses their older ethnicity estimates, the version 2.0 estimates as I stated above won’t be available until June.
I (and many other people) have always considered MyHeritage to have the least accurate ethnicity estimates of the major DNA testing companies. In my case, I have 4 Ashkenazi Jewish grandparents, 8 Ashkenazi Jewish great-grandparents and 16 Ashkenazi Jewish great-great-grandparents. If that’s not 100% Ashkenazi Jewish, then I don’t know what is.
My original estimates from my first MyHeritage DNA test gave me just 83.8% Ashkenazi. They did an update in 2020 which increased that to 85.5%, and another update last August that increased it again to 90.3%.
By comparison, my latest estimates of Ashkenazi at the other companies are:
- Family Tree DNA: 94%
- 23andMe: 98.8%
- Ancestry: 99%
All are much closer to 100% than MyHeritage’s 90.3%.
My new MyHeritage DNA test’’s ethnicity results is a tiny bit better at 90.8% and shows me this:
I have to disagree as I’m absolutely sure that I have zero Scandinavian, Irish, Scottish, Welsh, Greek or Italian in me.
In June, I’ll be able to see what the Ethnicity Estimates 2.0 give.
Comparing My Matches
MyHeritage’s setup with multiple tests is nice. I can compare the DNA matches in my two kits easily in two browser windows. Here’s the comparison:
My new test has fewer matches than my old test, but has more closer matches (extended family) than my old test. The 1 “Close family” is my uncle.
The 2017 test shows 1 Theory of Family Relativity, but that Theory is wrong. The new test does not show any Theories, but I likely have to wait until MyHeritage recalculates everyone’s Theories which they do from time to time, before I can see if any show up in my new test.
The 2017 test tells me 219 of my DNA matches’ trees have smart matches with my tree. The new test gives me 200. I can’t determine my relationship with any of those people.
Among my matches, I only know how 3 of them are related to me. My two closes matches are my uncle and a first cousin once removed. The only other is a 2C2R sharing 79.4 cM with me.
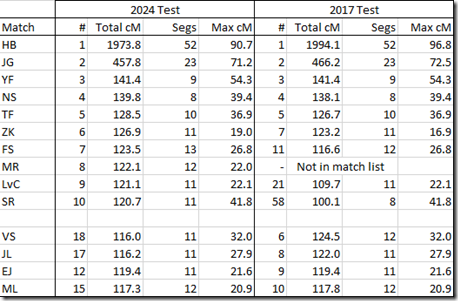
Here is a comparison of my top 10 matches.
The first 10 people are my 10 closest matches in my 2024 test. The first 5 are my top 5 in both tests, but then the order starts to diverge.
The next 4 people are from the top 10 in 2017 that did not make the top 10 in 2024.
You can see slight differences in the numbers between the two tests. I wouldn’t consider them to be significant. Although #10 has 3 more matching segments in 2024 than in 2017.
I am surprised that my 8th closest match of my 2024 test does not appear in my 2017 test results. Could it be a brand new tester who has not yet been updated in my older test? Not sure I have an explanation if that’s not the reason.
My Raw Data
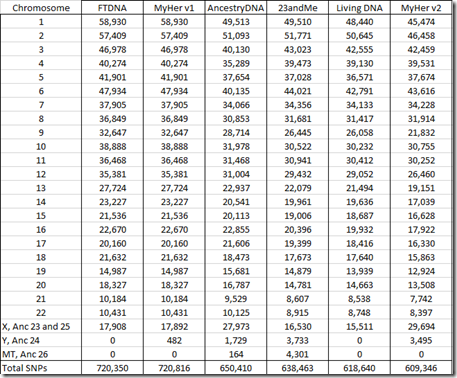
In my Comparing Raw Data from 5 DNA Testing Companies, I gave a summary table of the raw data files which I’ll update here adding my new test at the right: (click on the any table for a larger version):
The new raw data file includes fewer SNPs (609,346) than any of my previous tests. Let’s see which chromosomes are tested:
Interestingly, despite testing fewer SNPs overall, the raw data includes more SNPs from the X chromosome than any other company, and includes more SNPs from the Y chromosome than any company except 23andMe. The raw data does not include any mt (mitochondrial) SNPs.
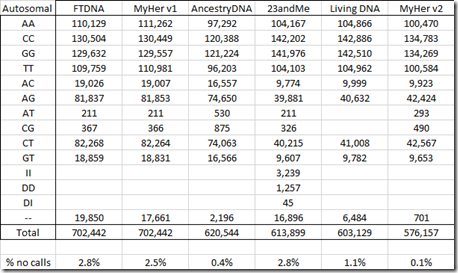
On the Autosomal chromosomes 1 to 22, these are the Allele values supplied:
There are only 701 no calls which is only 0.1% and that is much less than any of the other tests. Like the other companies except 23andMe, insertions and deletions are not included.
It is odd that FTDNA, MyHer v1 and AncestryDNA tests have about twice the number of heterozygous values than the 23andMe, LivingDNA and MyHer v2 tests have. Those are SNPs with different reads from the two chromosomes, i.e: AC, AG, AT, CG, CT and GT. The first three tests used the OmniExpress chip and the latter three used the GSA chip, so maybe something about the difference between these two chips caused this. But I don’t know the reason why.
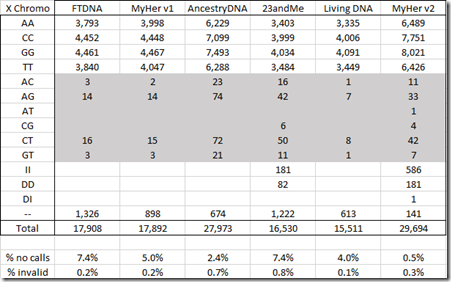
Here are the values for the X chromosome:
For the X, the new MyHeritage test has included insertions and deletions. Like autosomal, the X also has a much lower percentage of no calls (0.5%) than the other tests. The shaded area are read errors because I am male, so I only have one X chromosome and cannot have two different values. This new test has a similar read error rate (0.3%) to what the other tests did.
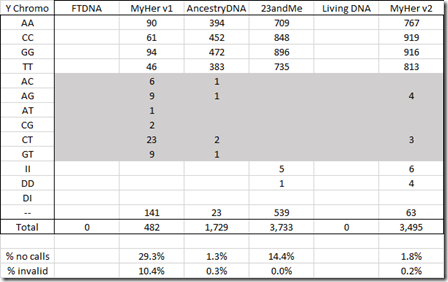
Here’s the Y chromosome:
Again, a low no call rate compared to the other tests and only 7 erroneous reads.
Combining These Results With My Others
In my Creating a Raw Data File from a WGS BAM file article, I ended up combining my 5 chip tests with my WGS test to end up with a raw data file with 1,601,497 SNPs with only 13,546 no calls (0.85%). I refer to that as my All-6 raw data file.
This new MyHeritage test has 609,317 SNPs.
It includes 15,215 new SNPs that were not included in any of my previous tests. Of those 15,095 had values and 120 were no calls.
It disagreed on 247 SNPs, so those need to be changed to no calls.
And it gave values to 3,483 SNPs that from the previous tests were only no calls.
So my All-7 combined file should therefore end up with:
- 1,601,497 + 15,215 = 1,616,719 SNPs
- 13,546 + 120 + 247 – 3,483 = 10,430 no calls
- 10,430 / 1,616,592 = 0.65%
and I will have reduced my percentage no calls from 0.85% to 0.65%.
Raw Data Accuracy
In my 2021 article: Your DNA Raw Data May Have Changed, I noted that the various testing company’s SNPs gave incorrect values for 0.2% to 0.5% of the SNPs which is pretty good. MyHeritage’s test originally was 0.2% (1 error every 603 SNPs) and one of the best. But then, after they changed my raw DNA data, the error rate increased to 0.8% (1 error every 119 SNPs) and it became one of the worst.
This isn’t really anything to worry about for matching relatives, because their matching algorithms allow for a few mismatches every 100 SNPs and still will say the two segments match. This is to take into account the occasional read error and the rare mutation. (No calls are ignored.)
But for analysis of a single SNP for medical purposes, the error rate is important. For that purpose, it is worthwhile knowing if the MyHeritage SNP error rate improved from 0.8%.
For this, I’ll Determine the Accuracy of my new MyHeritage DNA test by the way I describe in the section “The Accuracy of Standard Microarray DNA Tests” from my 2020 article: Determining the Accuracy of DNA Tests.
It seems that this new MyHeritage Test on the newer GSA chip is quite accurate with only 247 readings that differ out from the consensus of 588,234 SNPs of my other tests. That’s just a 0.04% error rate, or 1 error every 2,382 SNPs.
The next best error rate in my Accuracy article was 1 error every 1,391 SNPs for my short read WGS test and 1 out of 612 SNPs for my Family Tree DNA test.
Conclusion
Is it necessary to upgrade your MyHeritage DNA test if yours if your was done with the old Illumina OmniExpress chip up to 2019? For matching purposes, probably not.
But MyHeritage is not supporting the older results for their new ethnicity estimates that will come out in June. When the June results are released and people start reporting how their results changes, we’ll have a better idea whether it might be worthwhile to retest.


