DNA Testing companies provide you with your matches and quantify how closely you match each person by giving you a total value in centimorgans (cM).
In addition, companies other than Ancestry DNA also provide you with all your individual segment matches and tell you the centimorgans of every segment. For each segment they also tell you the segment’s starting and ending base pair location.
For example, at Family Tree DNA, I share 2009 cM with my uncle. These are what Family Tree DNA provides for the matches I have with my uncle on chromosome 1:
The Start Location and End Location are the position in base pairs (bp) along the chromosome where each match starts and ends as determined by Family Tree DNA.
Centimorgans
The Centimorgans value is a measure of the how likely it is that the segment will recombine in one generation. A segment of 1 centimorgan has a 1% chance of recombining. The general equation is:
Chance of recombination in one generation = 1 – (e ** (cM of segment / 100))
where e is the constant known as Euler’s number = 2.718281828…
So:
- a 1 cM segment has a 1 – (e ** –0.01) = 1.0% chance of recombining
- a 10 cM segment has a 1 – (e ** –0.1) = 9.5% chance of recombining
- a 30 cM segment has a 1 – (e ** =0.3) = 25.9% chance of recombining
- a 75 cM segment has a 1 – (e ** –0.75) = 52.8% chance of recombining
- a 200 cM segment has a 1 – (e ** –2.0) = 86.5% chance of recombining
On the ISOGG Wiki’s Centimorgan page, there is a nice graph of the probability of crossover by segment length.
Also on the ISOGG page you can see from their cM values per chromosome table that the centimorgans for chromosome 1 as of 2015 were:
- 267.21 at Family Tree DNA
- 281.5 at GEDmatch
- 284 at 23andMe
So each company provides slightly different estimates of centimorgans. For all the autosomes (chromosomes 1 to 22 and X), the totals range between 3580 and 3783 cM.
Recombinations are important because they represent a crossover of the two parental chromosomes, and that results in an endpoint for matches.
Males and females significantly differ in centimorgan values. Most companies don’t deal with male and female values, but use a combined average. That’s because once you’re talking about cousins and more distant relatives, the values tend to average out.
Base Pairs
A base pair is one individual position on a chromosome. It is made up as a pair of alleles that are bonded together, one from the chromosome’s forward strand and one from its reverse strand. Each allele has the value A, C, G or T, so the value of the base pair normally is shown as a pair of the values, e.g. AA or CT.
Surprisingly, ISOGG doesn’t have a table of the number of base pairs per chromosome, so you have to go to the Chromosome page on Wikipedia for it.
The autosomes (chromosomes 1 to 22 and X) total 3,022,102,095 base pairs, and chromosome 1 alone has 247,199,719 base pairs.
The number of base pairs given are very exact. They are all defined precisely so that references can me made to the specific base pairs of interest and everyone can “talk the same language” and be referring to the same segment on the chromosome.
Unfortunately, science is still working to fully define the human genome, so these base pair definitions are continuing to be updated. The National Library of Medicine maintains the Genome definitions. Here for example is GRCh37 from 2009, also known as Build 37 and as hg19. It was preceded by Build 36 (hg18) and by many other definitions before that. Build 37 itself has undergone 29 revisions and in 2013 was replaced by GRCh38 which itself is now at revision 14.
Obviously, DNA companies cannot be constantly changing their base pair several times each year. Fortunately, all the companies all decided to stick with a common version of Build 37 to define their allele locations. This is good because it allows DNA testers to transfer our raw data between platforms.
For the purpose of relative matching, only about 700,000 out of the 3 billion locations are tested, because these are the ones that are most likely to have differences between people or be of medical interest. These SNPs (Single nucleotide polymorphisms) generally are well-defined and should remain in the future builds of the human genome, although their position will continue to change as other positions between them are added and removed.
Why Do We Need to Map Mbp to cM?
For ancestry research, the cM value is important to have. Because of the way segment matching works, you can have segments that match simply by chance, where either allele of one person is matching either allele of the other person at each position of the segment. The cM value is a good measure of how likely this is to happen.
If you were comparing segments that are phased (separated correctly into their two parents) for both people, then this by chance matching wouldn’t happen. The ISOGG wiki has a nice graph of the probability a match survives phasing which indicates that segments under 15 cM are subject to being a by chance match, often referred to as a false match.
When using triangulated segments, you are comparing 3 people’s segments with each other and they must all match. The likelihood of false matches in this case is reduced and people like Jim Bartlett have indicated that by chance triangulated matches may start happening under 7 cM.
Therefore centimorgans tell us what segments are “too small” for our analysis.
If centimorgans were always available, then we’d be happy. But they are not always available.
Let us say you match two people, one on a 20 cM segment and the other on a 25 cM segment and the two segments overlap.
The problem is in determining how many centimorgans is the overlapping region between 30 Mbp and 50 Mbp? You don’t know that. You only know that the overlapping region is 20 Mbp. You would need to calculate the centimorgans it if you want it.
The Relationship Between Base Pairs and Centimorgans
Base pairs are large numbers expressing the position on the chromosome in millions to hundreds of millions. To simplify and approximate them, we can divide the values by 1 million and refer to Megabase pairs (Mbp).
So there are about 3,022 Mbp in the autosomes and 247 Mbp in chromosome 1 alone. Compare this to about 3,600 cM in the autosomes and 270 cM in chromosome 1. The Mbp and cM are similar. A simple rule of thumb is that the number of cM is roughly the same as the length of the segment in Mbp.
But there is quite a bit of variation. For example, the table above of my matches with my uncle can be re-expressed as:
As you can see, the ratio between cM of a segment and Mbp for the segment for this small sample of segments ranges from 0.83 to 2.37. This is because recombination rates vary considerably depending on which part of what chromosome you are looking at.
Family Tree DNA wrote this about how they determine the cM value for a DNA segment:
The Family Tree DNA bioinformatics team works with centiMorgan (cM) data from the International HapMap project.
Current knowledge of centiMorgan values across the human genome comes from the International HapMap project testing. The project tested father-mother-child trios from global population groups. Using this information, they mapped recombination rates across the human genome.
The tables they may be using could be the ones the NBCI made available in 2008. Here’s the beginning of Chromosome 1:
This is saying the cM/Mbp ratio is very low at the beginning of Chromosome 1, but once you reach position 711,153, the ratio has risen to 2 cM per Mbp.
To calculate the cM for a segment, subtract the cM value at the end position from the cM value at the start position. e.g. from 554,461 to 730,720, the cM would be calulated as 0.042 – 0.001 = 0.041 cM.
If you have a position between those listed, then you would interpolate to determine the cM for the position desired.
Checking the Calculations
Jonny Perl, the developer of DNA Painter, recently mentioned to me the work of Amy Williams, a computer scientist and geneticist at Cornell. Jonny provided me with Amy’s Minimal viable genetic map which reduces the HapMap from nearly 3.4 million entries to just over 32,000 entries. Jonny told me that this file works quite well for 23andMe and MyHeritage matches.
I took this map data and checked it against all the chromosome 1 segments from a Family Tree DNA test that I’ll call “Terry”. I was surprised to see poor results.
So I re-did this but used my own test’s matches at Family Tree DNA, 23andMe, MyHeritage and GEDmatch. I found that Jonny was correct and both 23andMe and MyHeritage gave good results, but Family Tree DNA and GEDmatch gave poor results.
Family Tree DNA and GEDmatch had a standard deviation between 1.2 and 1.7 cM which meant they were only accurate 95% of the time to within 3 cM. If you are trying to see if a segment is above or below a 7 cM or even a 15 cM threshold, an accuracy of +/- 3 cM is really not very good.
Not only that, the GEDmatch cM values on average were 1.1 cM different from the map calculations, so there must be a bias in the GEDmatch values.
I then took a look at the extreme values, the ones where the map’s calculations were furthest from the company’s calculations, by cM difference, and by percentage difference::
Out of 5221 segments, every one of MyHeritage’s calculations were within 0.1 cM of the Map calculation. They were not exact however, so MyHeritage must have been using a mapping very close to what Amy produced.
23andMe were not quite as close, but were still close enough that Amy’s mapping could be used for them.
Whereas Family Tree DNA and GEDmatch must be using a different mapping.
Methods to Calculate cM from Mbp.
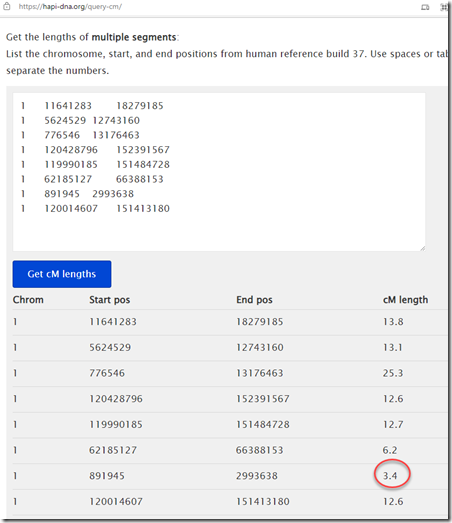
There are a few different Mbp to cM calculators available out there. First there’s Amy’s own calculator using her minimal map, called Lookup segment cM. I can take my extreme valued segments from above. Of the 10, 8 are different. If I plug those 8 segments into Amy’s calculator, I get:
These are all the same as I got when using and interpolating Amy’s table myself, except for one value which came out as 3.4 cM instead of 3.7 cM. I’m not sure why the difference in that one, but 7 out of 8 ain’t bad.
Amy allowed Jonny Perl to port her program so you’ll also find it as the cM Estimator tool on his DNA Painter site.
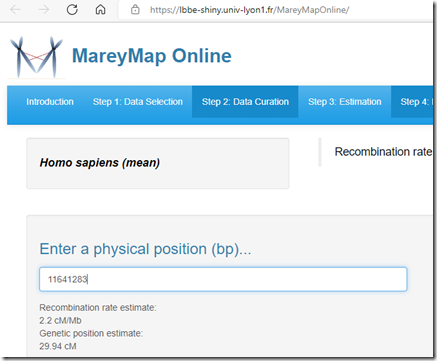
There is an online service for estimating recombination rates along the genome called MareyMap Online. Genealogists will normally want to select Homo sapiens, and could choose mean, male or female. They have 3 different estimation methods you can choose from: Sliding window, Loess, and Cubic Splines. Once you do that, you can then calculate the Genetic cM position from a physical position (bp):
I used the default settings (Loess method) and found the genetic positions for each of the 16 start and end points, I did this for the both the mean values and the male values. Subtracting the genetic end point from the start point gives the centimorgan value for the segment.
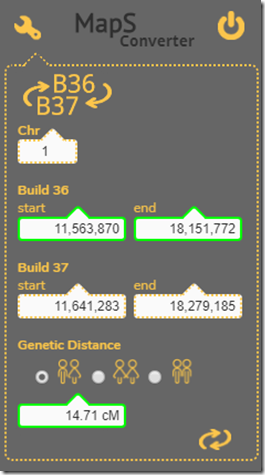
Hendrick Wendland created a MapS Converter program that you were at one time able to download. Seems the download is not working currently. But I still had it on my computer and tried it out.
It has a nice feature of being able to convert between Build 36 and Build 37 base pair locations, and you can select between mean, female and male
I compared the results of the three tools to the extreme values I had. I marked those closest to the company value in green and those not closest but still within 1 cM of the company value in yellow:
Well the results are all over the board. The data I was using are the extreme outliers for Amy’s mappings so it was a tough test.
It is possible that MapS is giving similar results as GEDmatch, so maybe GEDmatch is using a similar mapping. And MareyMap Online’s male values give the closest match to the extreme FTDNA values. More testing with a bigger dataset would be needed to confirm these statements.
What this all says is that there are many different mapping tables that can be used and it looks like each company has chosen their own mapping method.
Why I Investigated This
My program Double Match Triangulator (DMT) screens small segments out by using a cM threshold for single segments and another one for triangulations. For triangulations, 3 segments are involved, and they must all be at least the default 7 cM (which the user can set to something else). The segment match data gives cM values. But they don’t always give the size of the triangulation itself. You still may have three 15 cM segments that all overlap, and that overlap which is the triangulating region might be only 2 cM. It would be nice to filter those out.
Also there are some inferred segments where the cM cannot be calculated because it the segment adjacent to a triangulation where Person A no longer matches. If that extension cM could be calculated, then those that are too small could be filtered out.
When Jonny provided me with Amy’s data, I started to implement it into DMT but did not like the results for Family Tree DNA data. I likely wouldn’t have noticed it if I had first tried it for MyHeritage or 23andMe data.
Going forward, if I do decide to try to determine the centimorgans of the unknown triangulating sections and inferred match extensions, I’ll take the cM values that the company provided with the matches and build an internal map of Mbp to cM. Then I’ll use that map to interpolate the cMs of the needed segments. At least that way, the estimate that is used will be reflective of the company’s mapping.
This is not a major thing for DMT. Adding it would slow DMT down and I don’t feel the benefits of determining the centimorgans of triangulations and inferred segment extensions is worth the slowdown.


Joined: Mon, 13 Jun 2022
1 blog comment, 0 forum posts
Posted: Mon, 13 Jun 2022
I remember stumbling across the same issue when implementing AutoSegment. I also found that FTDNA en GEDmatch were sometimes quite off compared to other companies. One of the reasons for FTDNA back then was the fact they were still using build 36 whereas the others were using 37. Sometimes the locations were quite different, in some extreme cases entire segments were not even overlapping.
Also, if I remember correctly, GEDmatch employs old Rutgers (?) tables to calculate the cM values. So these are probably outdated as well. I also ended up using a human genetic map to re-calculate segments and calculate the overlap.
Joined: Sun, 9 Mar 2003
291 blog comments, 245 forum posts
Posted: Mon, 13 Jun 2022
Thanks EJ, for your confirmation about the issue. I came up with a new idea that I’m going to try out, which may result in my next blog post.