Ten days ago, I produced an article: Revisiting Speed and Balding, where I tried to duplicate the results of their Figure 2B. I posted a link to the article on the ISOGG Facebook group, and received a lot of comments, mostly from Andrew Millard and Debbie Kennett. Debbie also provided quite a few comments directly on my post and contacted one of the authors, Doug Speed, who then also commented on my post. He indicated he’s confident his simulation results were accurately tabulated and suggested “the differences come from us asking slightly different questions”. I’m trying to answer the question:
For a match at a specific segment length, what is the probability that the segment comes from a particular generation?
That’s what I thought Speed and Balding were answering as well, so I’m unclear as to what the difference might be.
I thought one possible difference might be that I’m taking this from the perspective of the matches in your match list at Family Tree DNA. Debbie Kennett rightly pointed out that the inclusion of only DNA matches would only affect very small segments under 9 cM, since at least one segment of 9 cM or more (or 7.69 cM plus a minimum 20 cM total) is required before the person is considered a match. So that is not a question difference that would have affected the 10 to 40 Mb range where my statistical numbers significantly differ from their simulation numbers.
David Millard rightly pointed out that I was one generation off in my Expected number of cousins, but that wouldn’t change my results much. He also didn’t think that my figure titled: “Addition of Inverse IBD Region Length Distributions” was close to Speed and Balding’s Figure 2B, but that fact of the matter was that no matter what reasonable methodologies I could think of trying, that was the closest I could get to Speed and Balding’s result.
So I do not agree with Speed and Balding’s figure 2B. It would be nice to see if anyone else has done some similar calculations and compare.
In one of Debbie Kennett’s comments during our discussions, Debbie provided a link to an article that gave some data that looked like it could be used to do a third estimation of what Speed and Balding’s Figure 2B might be. The article is by Bob Jenkins and is titled: How many genetic ancestors do you have?
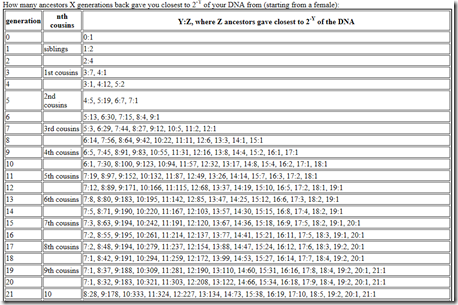
Genetic ancestors don’t help us that much, but Jenkins goes on to then estimate the number of cousins by generation by segment length. He gives one table for females and one for males. They are fairly similar but the male table has a few inconsistencies that the female doesn’t, so I’ll just use the female table. Bob Jenkin’s table looks like this:
And it goes all the way to 100 generations. Let’s interpret this. Pick 4th cousins.
That line says it’s generation 9, but this is counting every step up and down. Translating that to Speed and Balding’s value of G would make it G=5.
Then we see “6:5”. That means 5 cousins would have 1 / (2**6) of the DNA of the ancestor, which is 0.015625, which multiplied by 6800 total cM gives 106 cM, or multiplied by 5334 total Mb gives 83 Mb.
Then we see “7:45”. That means 45 cousins would have 1 / (2**7) of the DNA of the ancestor which is 53 cM or 42 Mb.
Etc.
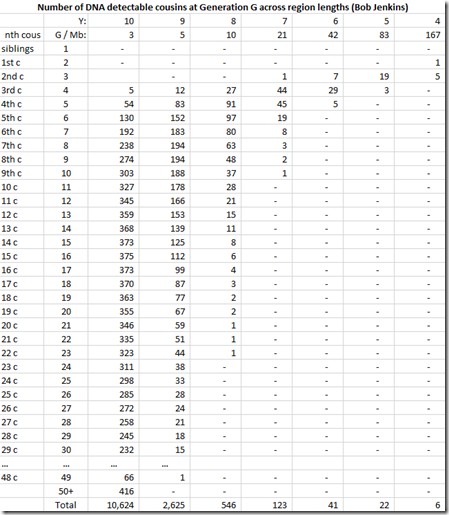
So we now put this all into a spreadsheet:
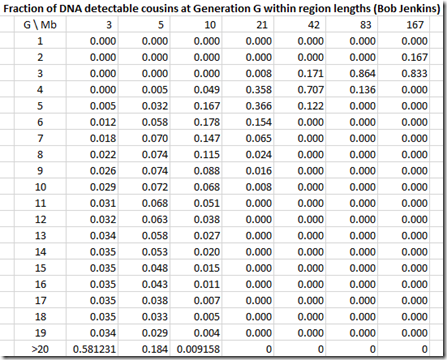
and we divide by the column total to get the likelihoods:
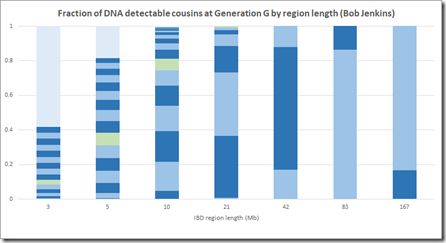
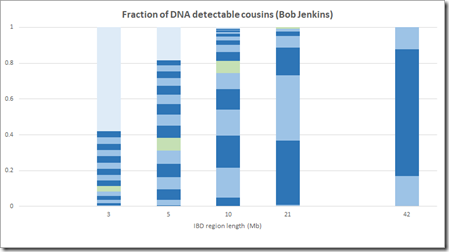
Plotting this in the Speed and Balding manner gives:
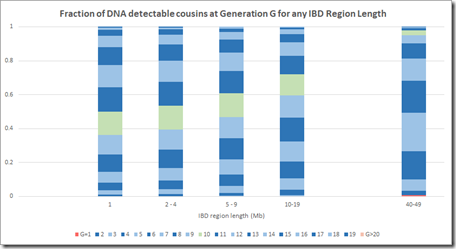
Bob Jenkins does not give the same region lengths as Speed Balding. Jenkins uses region lengths that double, so we have to be careful in our comparison. Let’s compare Jenkin’s 3 Mb with SB’s 2-4, Jenkin’s 5 Mb with SB’s 5-9, 10 with 10-19, 21 with 20-29 and 42 with 40-49.
Here is Jenkins above lined up for comparison:
Below are my final calculations from my article 10 days ago that were calculated using Speed Balding’s values for the probability of region length and the ISOGG table for number of cousins which I then extended until it reached the world population:
Note that Jenkins has no visible G>20 (very light blue) at 10 Mb and 21 Mb which agrees with what I came out with.
Compare this with Speed and Balding for the equivalent segments. Look at how much G>20 (the grey shade) there is between 5 and 20 Mb. That is the part that I cannot believe is reasonable, and neither can Jenkins.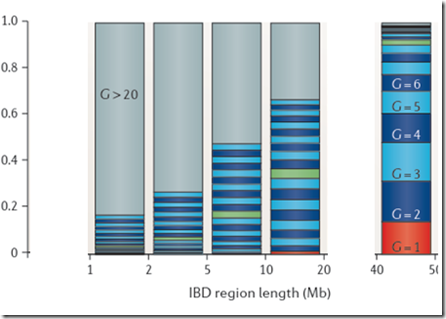
For the smaller regions, under 10 Mb, Jenkins does include a significant amount of G>20 segments (very light blue). But when you look at your match list, those are not included because a match of 20 generations or more with almost always match on just one segment. And if that segment is 9 cM or less, then it won’t be considered a match at Family Tree DNA and won’t show up in your match list. My results don’t show any G>20 for any segment length, but neither Speed Balding nor Jenkins do and both of them show many G>20 for small segments smaller than 10 Mb.
The bottom line is that I don’t believe that Speed and Balding’s Figure 2B is appropriate to apply to the segment lengths of the matches in your match list. There is something undetermined that they don’t take into account.
Conclusion: Almost all your matching segments with any of your matches at any segment length will be within 20 generations. Small segments under your DNA company’s minimum match limit (e.g. 9 cM at FTDNA) will also be within 20 generations because people with segments that small from more than 20 generations back will not be in your match list.
The ISOGG Facebook group is a closed group, but if you have been given access to it, the comments there about this article are a worthwhile read.
—
Update: Mar 24, 2018. New discussion about my articles took place on my comment in the closed Facebook group: Genetic Genealogy Tips & Techniques. I’d like to add here what I said there, because it is significant.
I think it is inappropriate to relate Speed and Balding’s results to what we see in our matches, mainly because what we see are filtered by the DNA companies by their minimum match criteria which will eliminate almost all people who only have distant small segments in common. The expected amount of DNA we share with people beyond 15 generations from us will seldom make it through this filtering and thus won’t be in the segments of our matches.
But Speed and Balding include all segments unfiltered, and they did it for a different purpose, specifically to find in their simulation individuals unrelated for a disease study. Their study is excellent for that purpose. So their population geneticist peers naturally and correctly accepted the paper and those findings.
My objection is that some genetic genealogist, I don’t know who, happened to find their paper and blindly apply their results to his/her segment matches. Then everyone followed suit and the use of their Figure for segment to genetic distance made it into the ISOGG Wiki. This action of inappropriately applying a result is what does not and did not get peer reviewed, but simply gets published and virally repeated as fact like an incorrect ancestor in an online family tree, and is thus so hard to correct or even get anyone to realize. It is the inapplicability of their result to our filtered segment matches that I’m trying to point out and dispute to the genetic genealogy community.
I should note that prominent genetic genealogist Debbie Kennett disagrees with me on this and says: “The Speed and Balding results are perfectly applicable to genetic genealogy so long as we bear in mind that they are a simplification.” With my disagreement to that noted, I invite readers to examine my arguments and decide for yourself.
—
Update: Aug 20, 2019. I have done another calculation in my article: The Life and Death of a DNA Segment, which is based on segment life. Once again, this gives fewer generations than Speed and Balding does.

